Inspect candidates
Open the table tab for a list of all the added candidates. Reorder and filter columns to compare data, or select a candidate to see its structure in the viewer.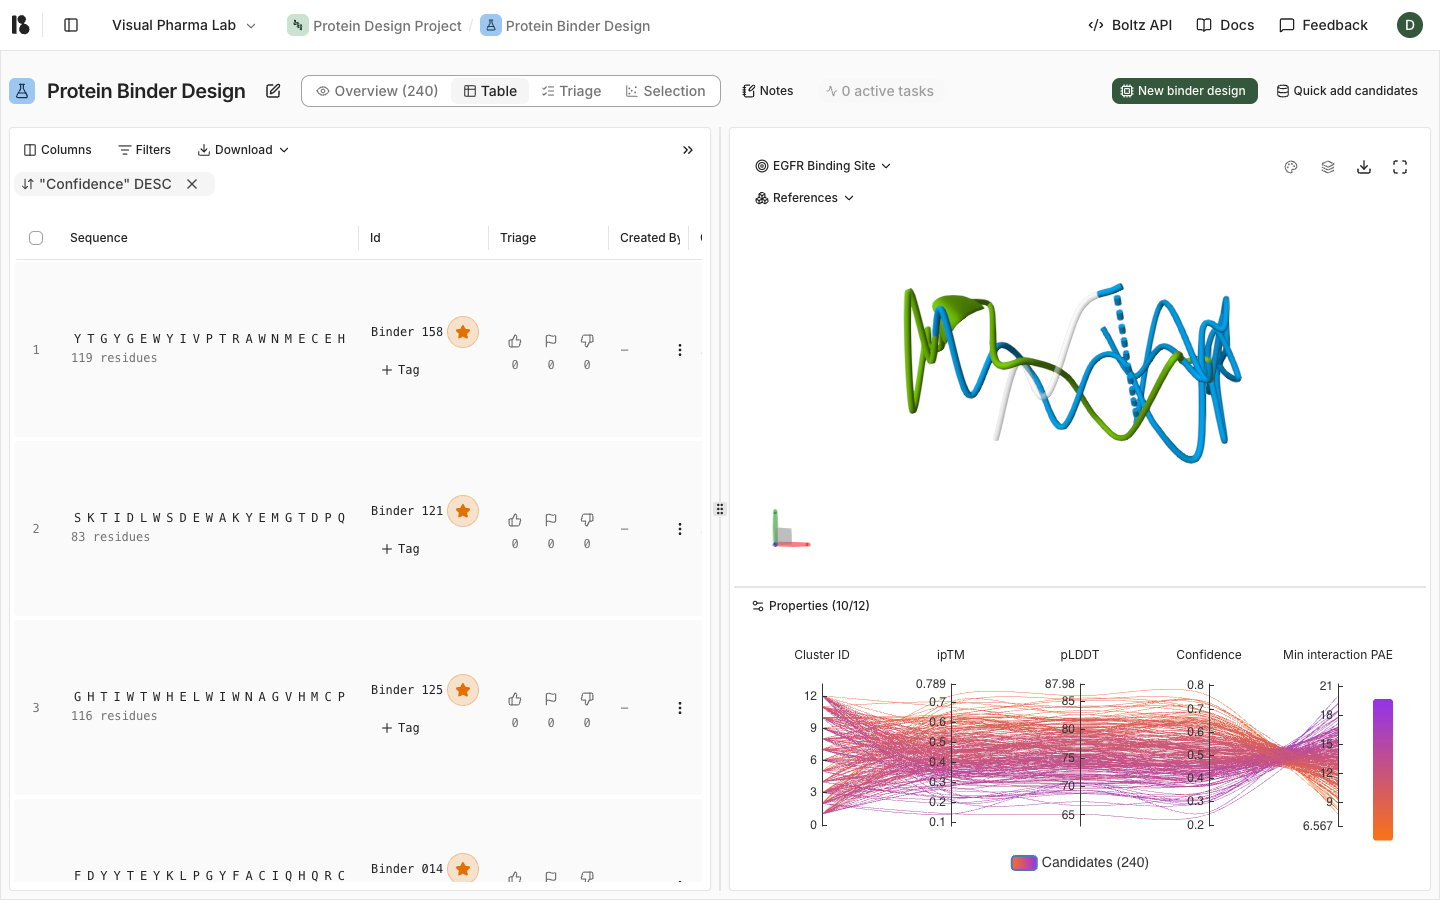
Compare candidate diversity
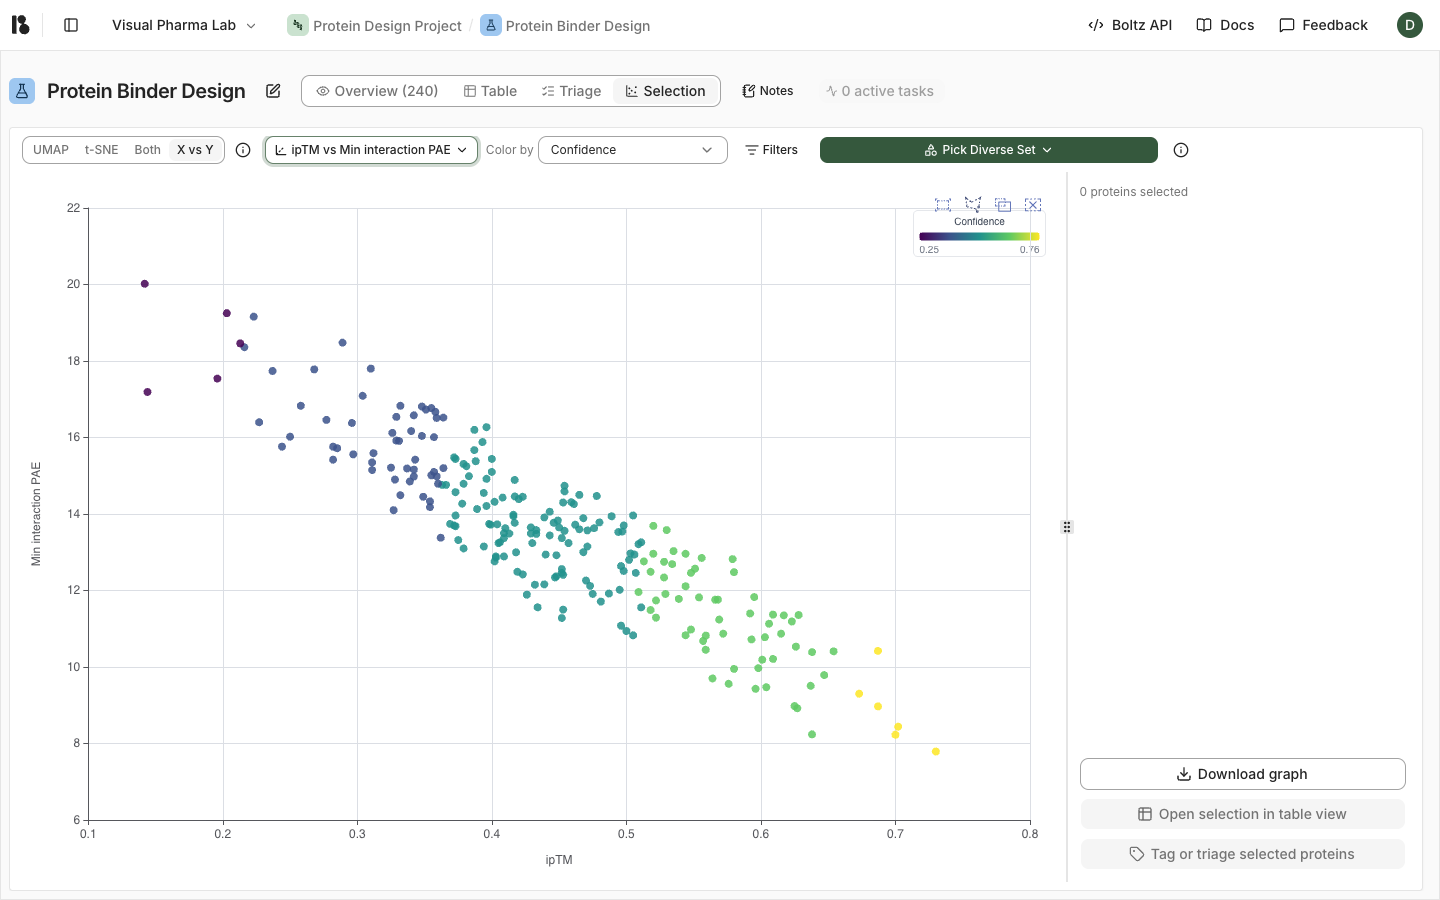
Open Selection to compare candidate metrics in aggregate. Use X vs Y to plot candidates by two properties. Select candidates on the plot to tag or triage them, or export the graph itself. Selection and comparison can also be done using the candidates’ epitopes:- UMAP and t-SNE lay out binders by epitope. Binders that contact the same residues are near each other.
- Pick Diverse Set automatically selects a set of candidates with diverse epitopes. Use the sliders to set the balance between score and epitope diversity.